
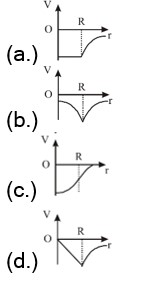
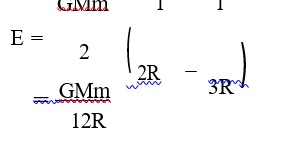
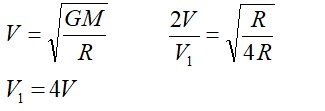
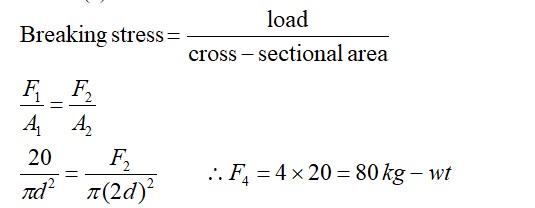
The diagram showing the variation of gravitational potential of earth with distance from the centre of earth is
The diagram showing the variation of gravitational potential of earth with distance from the centre of earth is
Option 1 - <p>a</p>
Option 2 - <p>b</p>
Option 3 - <p>c</p>
Option 4 - <p>d</p>
18 Views|Posted 6 months ago
Asked by Shiksha User
1 Answer
 Upvote
Similar Questions for you
Due to Interference, soap bubble appears coloured.
Value of 'g' increases at the equator when earth suddenly stops rotating.
Taking an Exam? Selecting a College?
Get authentic answers from experts, students and alumni that you won't find anywhere else.
On Shiksha, get access to
66K
Colleges
|
1.2K
Exams
|
6.9L
Reviews
|
1.8M
Answers
Learn more about...

Didn't find the answer you were looking for?
Search from Shiksha's 1 lakh+ Topics
or
Ask Current Students, Alumni & our Experts
Have a question related to your career & education?
or
See what others like you are asking & answering