
An Ellingham diagram provides information about:
An Ellingham diagram provides information about:
Option 1 - <p>The condition of pH and potential under which a species is thermodynamically stable.</p>
Option 2 - <p>The standard Gibbs energies of formation of some metal oxides</p>
Option 3 - <p>The kinetics of the reduction process</p>
Option 4 - <p>Standard electrode potentials of reduction reactions involved in the extraction of metals<br><!-- [if !supportLineBreakNewLine]--><br><!--[endif]--></p>
1 Views|Posted 10 months ago
Asked by Shiksha User
1 Answer
A
Answered by
10 months ago
Correct Option - 3
Detailed Solution:
Ellingham diagram provides information on Gibb's free energy for formation of oxides as a function of temperature.
 Upvote
Similar Questions for you
ΔG° = –RT * 2.303 log K
–nFE° = +RT * 2.303 log K
2 * 96500 * 0.295 = 8.314 * 298 * 2.303 log10 K
10 = log10 K = 1010
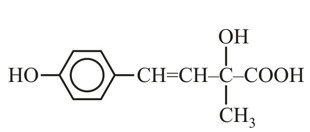
It has chiral centre and differently di substituted double bonded carbon atoms.
Rate of ESR ∝ No. of α – H (Hyperconjugation)
Cr3+ion is a most stable in aqueous solution due to. t2g half filled configuration
Taking an Exam? Selecting a College?
Get authentic answers from experts, students and alumni that you won't find anywhere else.
On Shiksha, get access to
66K
Colleges
|
1.2K
Exams
|
7L
Reviews
|
1.9M
Answers
Learn more about...

Chemistry Ncert Solutions Class 12th 2023
View Exam DetailsMost viewed information
SummaryDidn't find the answer you were looking for?
Search from Shiksha's 1 lakh+ Topics
or
Ask Current Students, Alumni & our Experts
Have a question related to your career & education?
or
See what others like you are asking & answering