
Which one of the following given graphs represents the variation of rate constant (k) with temperature (T) for an endothermic reaction?
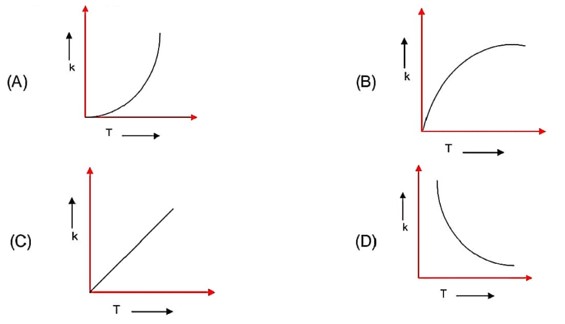
Which one of the following given graphs represents the variation of rate constant (k) with temperature (T) for an endothermic reaction?
Option 1 - <p>(a)</p>
Option 2 - <p>(b)</p>
Option 3 - <p>(c)</p>
Option 4 - <p>(d)</p>
22 Views|Posted 10 months ago
Asked by Shiksha User
1 Answer
A
Answered by
10 months ago
Correct Option - 1
Detailed Solution:
Rate constant depends on temperature as
Here; as T increases rate constant increases exponentially.
 Upvote
Similar Questions for you
Rainbow is formed due to internal reflection and dispersion.
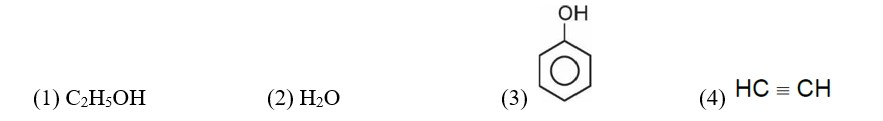
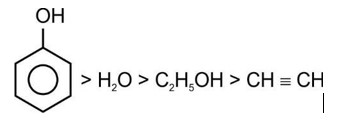
Correct order of acidic strength
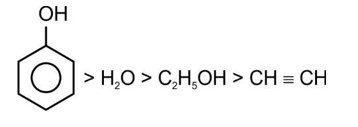

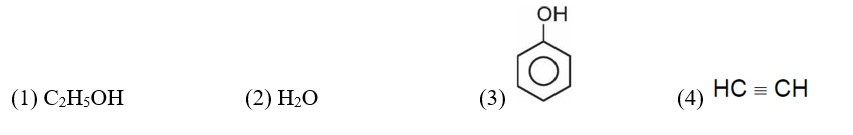
Correct order of acidic strength
Taking an Exam? Selecting a College?
Get authentic answers from experts, students and alumni that you won't find anywhere else.
On Shiksha, get access to
66K
Colleges
|
1.2K
Exams
|
7L
Reviews
|
1.9M
Answers
Learn more about...

Chemistry Ncert Solutions Class 12th 2023
View Exam DetailsMost viewed information
SummaryDidn't find the answer you were looking for?
Search from Shiksha's 1 lakh+ Topics
or
Ask Current Students, Alumni & our Experts
Have a question related to your career & education?
or
See what others like you are asking & answering