
Direction for question 5 to 8: Go through the data set given below and solve the questions based on it.
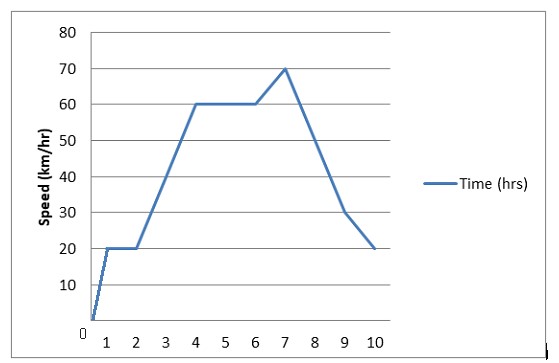
What is the average speed represented in the above graph?
Direction for question 5 to 8: Go through the data set given below and solve the questions based on it.
What is the average speed represented in the above graph?
The average speed in first hour = 10 km/hr
Average speed represented by the graph
 Upvote
Similar Questions for you
(c) &n
the highest average is Rs. 136
Using the data from above question, the lowest average is Rs. 100.
We get the following table of earnings:
Persons | Win Total | Average |
P | 36 * 150 + 14 * 100 = 6800 | 136 |
Q | 34 * 150 + 21 * 100 = 7200 | 131 |
R | 23 * 150 + 36 * 100 = 6850 | 116 |
S | 30 * 150 + 30 * 100 = 6000 | 100 |
Now we can see that the largest difference
= Maximum – Minimum = Rs. 7500 – Rs. 6800
= Rs. 700
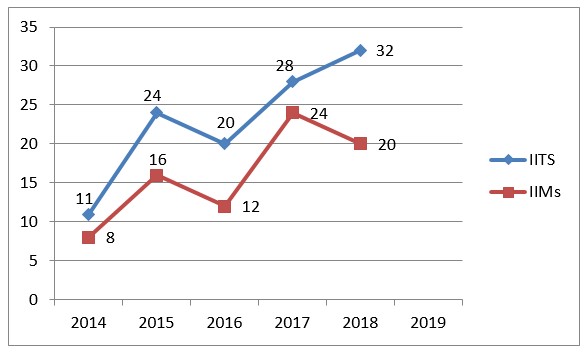
IITs = 60; IIMS = 40
Taking an Exam? Selecting a College?
Get authentic answers from experts, students and alumni that you won't find anywhere else.
On Shiksha, get access to
Learn more about...

DILR Prep Tips for MBA 2026
View Exam DetailsMost viewed information
SummaryDidn't find the answer you were looking for?
Search from Shiksha's 1 lakh+ Topics
Ask Current Students, Alumni & our Experts
Have a question related to your career & education?
See what others like you are asking & answering