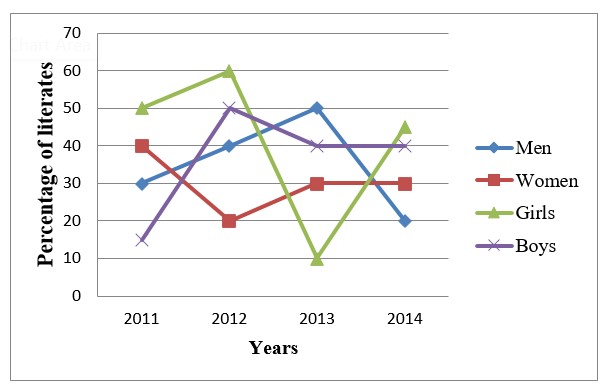
There are 20000, 30000, 40000 and 50000 men in a town over a period of 4 years from 2011 to 2014. In the same period, the number of women has increased at the rate of 10 percent every year, beginning at 13000 in 2011. The number of boys in the town increases at 5 percent per year. In 2014, the number of boys is 12000. The number of girls has been increasing at 25 percent and in 2014 their number was 10000.
The line graph below shows the percentage of literates in the town between 2011 and 2014.
In which year is the number of literates in the town maximum?
(c) rather than calculating for each year, we can deduce that since the number of men is significantly greater than the other three, the maximum number of literacy rate for men.
In 2003, the literacy rate for men is 50 percent, which is the highest for his category.

 Upvote