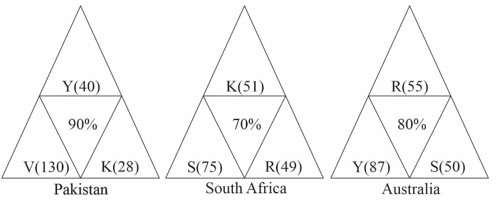
Coach Rahul sat with the score cards of Indian players from the 3 games in a one-day cricket tournament where the same set of players played for India and all the major batsmen got out. Rahul summarized the batting performance through three diagrams, one for each game. In each diagram the three outer triangles communicate the number of runs scored by the three top scorers from India, where K, R, S, V and Y represent Krunal, Rohit, Sanjay, Virat and Yogesh respectively. The Middle triangle in each diagram denotes the percentage of total score that was scored by the top three Indian scorers in that game. No two players score the same number of runs in the same game. Rahul also calculated two batting indices for each player based on his scores in the tournament; the R-index of a batsman is the difference between his highest and lowest scores in the 3 games while the M-index is the middle number, if his scores are arranged in a non-increasing order.
For how many Indian players is it possible to calculate the exact M-index?

 Upvote