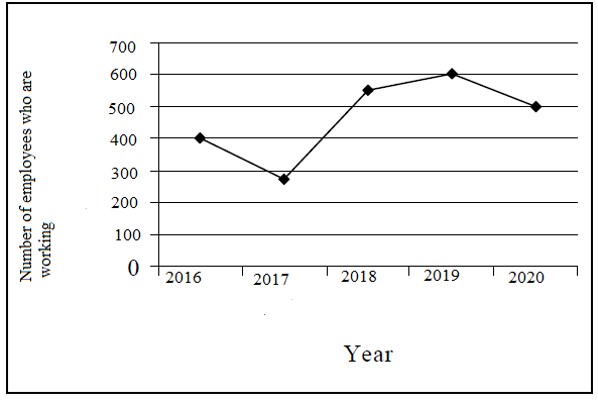
The first table gives the percentage of employees in skyroot, who work in the department of finance marketing and software. The second table gives the average starting salaries of the employees per month (Rs. in thousands) in these. The line graph gives the no. of employees who are working for Skyroot each year.
First Table
Finance
Marketing
Software
Others
2016
22
36
19
23
2017
17
48
23
12
2018
23
42
21
13
2019
19
37
16
28
2020
32
32
20
16
Second Table
Finance
Marketing
Software
2016
54500
51700
52900
2017
63800
63900
64400
2018
75500
76300
70500
2019
89200
89600
77600
2020
92100
102200
86400
What is the percentage increase in the average salary of finance employee from 2016 to 2020 ?
From the 1st statement: B2 is now as old as B3 was in the past. Hence B2 is younger to B3 or B2 < B3. Also sometime in the past B1 was twice as old as B4. So B1 is elder to B4 or B1 > B4. B3 will be as old as B5 in future, hence B3 < B5. The second statement suggests: B1 > B6. B1 was as old as B7 in the past. Hence B1 > B7. B4 will be as old as B6 in future. Hence B6 > B4. B6 will be as old as B7 now in future. Hence B7 > B6

 Upvote
