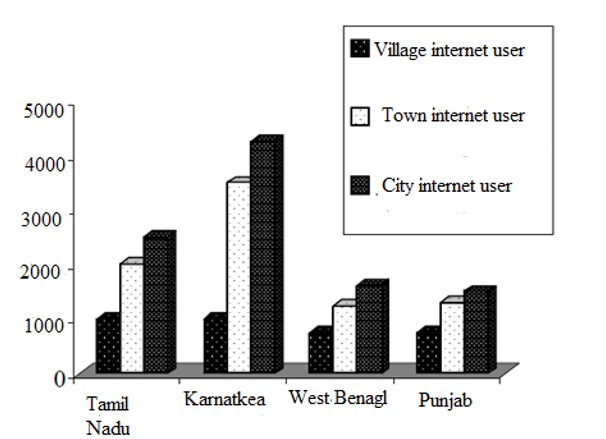
The following bar chart gives the increase in internet user percentage of villages, towns and cities in the four states for the period between 2018-19 and 2020-21. The table provides information about the number of households who uses internet, average expenditure by a household and growth on expenditure on internet by a household.
Number of households in 1987-88 (in thousands)
Average expenditure by house hold in internet on 2018-19
Growth in average household expenditure on internet (2018-19 over 2019-20)
Village
400
Rs. 30,00
50%
Town
100
Rs. 50,00
60%
City
50
Rs. 75,00
90%
What is the percentage increase in total numbers of households that uses internet in towns of Tamil Nadu's over the given periods ?
Option 1 -<p><span lang="EN-IN">100 %</span></p>
Option 2 -<p><span lang="EN-IN">200 %</span></p>
Option 3 -<p><span lang="EN-IN">240 %</span></p>
Option 4 -<p><span lang="EN-IN">Cannot be determined</span></p>
From the 1st statement: B2 is now as old as B3 was in the past. Hence B2 is younger to B3 or B2 < B3. Also sometime in the past B1 was twice as old as B4. So B1 is elder to B4 or B1 > B4. B3 will be as old as B5 in future, hence B3 < B5. The second statement suggests: B1 > B6. B1 was as old as B7 in the past. Hence B1 > B7. B4 will be as old as B6 in future. Hence B6 > B4. B6 will be as old as B7 now in future. Hence B7 > B6

 Upvote
