
The line chart given below shows the yearly production of Amul and Nutralite butter.
The bar chart given below it shows the Female and male population in these years.
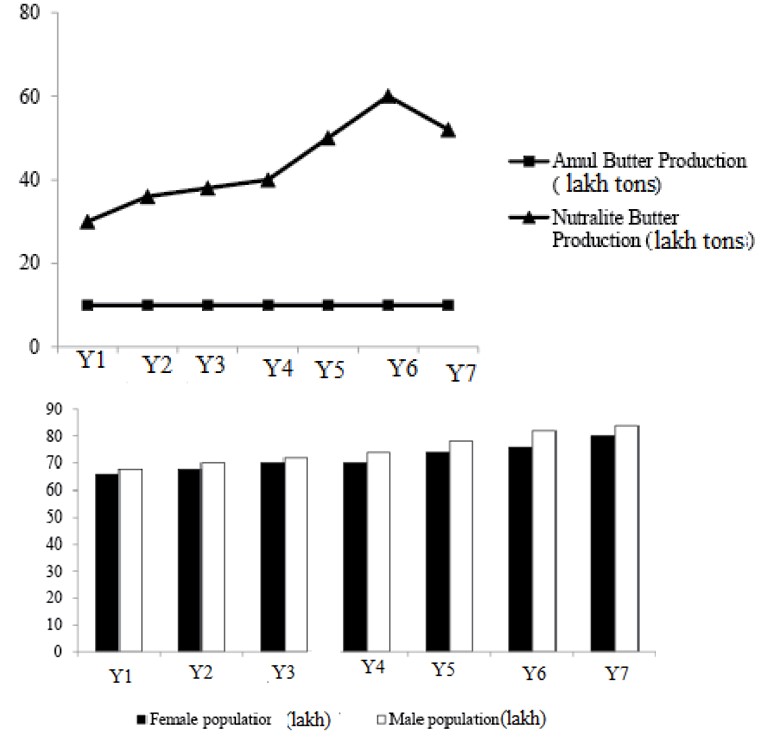
In which year was per capita production of Nutralite Butter the most?
The line chart given below shows the yearly production of Amul and Nutralite butter.
The bar chart given below it shows the Female and male population in these years.
In which year was per capita production of Nutralite Butter the most?
The per capita production of Nutralite Butter was the most in 2013. (by observation)
 Upvote
Similar Questions for you
Please find the answer below
From the 1st statement: B2 is now as old as B3 was in the past. Hence B2 is younger to B3 or B2 < B3. Also sometime in the past B1 was twice as old as B4. So B1 is elder to B4 or B1 > B4. B3 will be as old as B5 in future, hence B3 < B5. The second statement suggests: B1 > B6. B1 was as old as B7 in the past. Hence B1 > B7. B4 will be as old as B6 in future. Hence B6 > B4. B6 will be as old as B7 now in future. Hence B7 > B6
According to the information provided following arrangement will be obtained:
(K→ Kerala ; G → Goa ; D → Delhi)
Order according to height | Student | Belong | |||||||||
1 | 2 | 3 | 4 | 5 | 6 | 7 | 8 |
| K | G | D |
× | × | × | × | × | × | × | √ | Arun | × | × | √ |
× | × | √ | × | × | × | × | × | Ajit | √ | × | × |
√ | × | × | × | × | × | × | × | Rohan | √ | × | × |
× | × | × | × | × | √ | × | × | Gajraj | × | √ | × |
× | √ | × | × | × | × | × | × | Ronit | × | × | √ |
× | × | × | × | √ | × | × | × | Shubham | √ | × | × |
× | × | × | × | × | × | √ | × | Sweety | × | √ | × |
× | × | × | √ | × | × | × | × | Lovely | × | √ | × |
Looking at the table given in the first question of the set, we get that Talwar lives on the sixth floor.
The data available is not enough to determine where Rubi belongs to. The given data is insufficient to answer the above question.
Taking an Exam? Selecting a College?
Get authentic answers from experts, students and alumni that you won't find anywhere else.
On Shiksha, get access to
Learn more about...

Didn't find the answer you were looking for?
Search from Shiksha's 1 lakh+ Topics
Ask Current Students, Alumni & our Experts
Have a question related to your career & education?
See what others like you are asking & answering