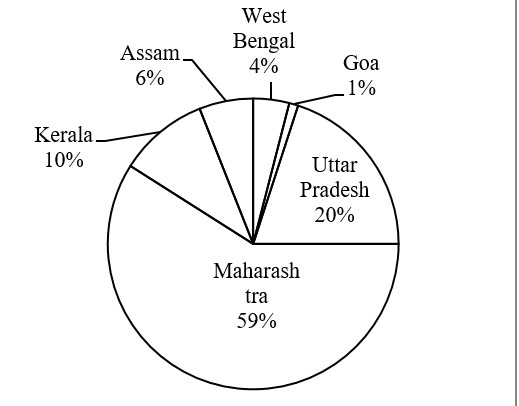
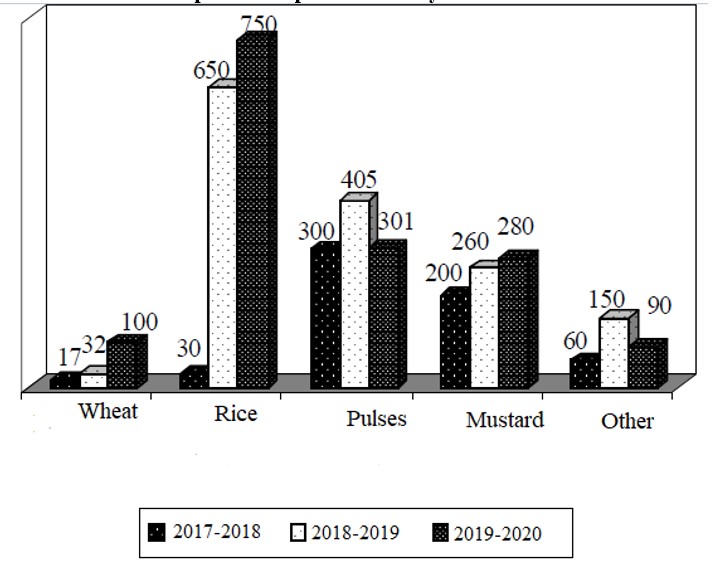
The pie chart given below show the crops exporting states of India in 2017-18 and the bar graph shows the 5 types of crop exported by Madhya Pradesh (in lakhs)from 2017-18 to 2019-20 .
To Exporting states of India of crops in 2017-18
Export of crops from Madhya Pradesh
If crops from Madhya Pradesh constituted 10% of India trade in 2017-18, then the export of Maharashtra in the nation crops trade in 2017-18 ?
From the 1st statement: B2 is now as old as B3 was in the past. Hence B2 is younger to B3 or B2 < B3. Also sometime in the past B1 was twice as old as B4. So B1 is elder to B4 or B1 > B4. B3 will be as old as B5 in future, hence B3 < B5. The second statement suggests: B1 > B6. B1 was as old as B7 in the past. Hence B1 > B7. B4 will be as old as B6 in future. Hence B6 > B4. B6 will be as old as B7 now in future. Hence B7 > B6

 Upvote
