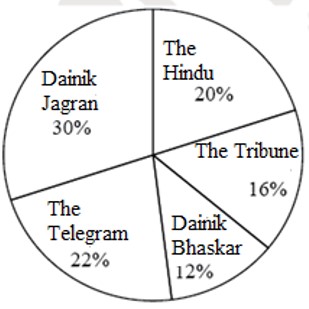
The pie chart given below shows the total number of people and the number of women who reads 5 different news paper.
Percentage of people who reads different newspaper in a town
Total number of people = 35,000
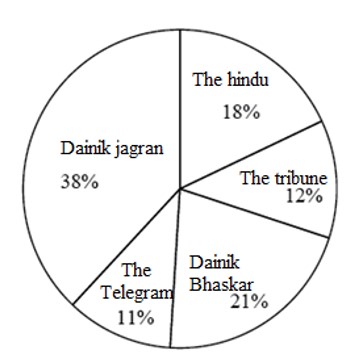
Percentage break-up of female who reads different newspaper in town
Total number of females = 15,000
If 20% of the females who reads in the telegram change their liking to the tribune then what will be the new number of the tribune consumed by the people altogether?
From the 1st statement: B2 is now as old as B3 was in the past. Hence B2 is younger to B3 or B2 < B3. Also sometime in the past B1 was twice as old as B4. So B1 is elder to B4 or B1 > B4. B3 will be as old as B5 in future, hence B3 < B5. The second statement suggests: B1 > B6. B1 was as old as B7 in the past. Hence B1 > B7. B4 will be as old as B6 in future. Hence B6 > B4. B6 will be as old as B7 now in future. Hence B7 > B6

 Upvote
