
13.3 Figure 13.8 shows plot of PV/T versus P for 1.00*10–3 kg of oxygen gas at two different temperatures.
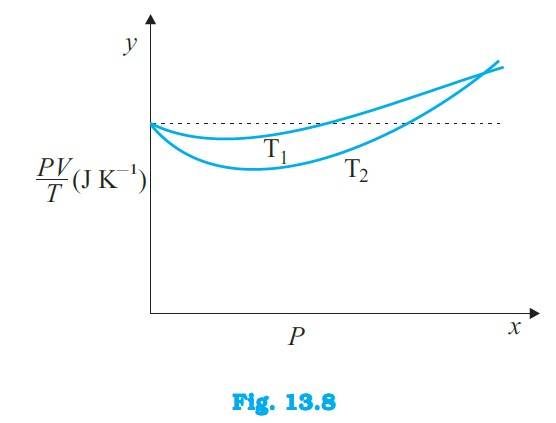
(a) What does the dotted plot signify?
(b) Which is true: T1 > T2 or T1 < T2?
(c) What is the value of PV/T where the curves meet on the y-axis?
(d) If we obtained similar plots for 1.00*10–3 kg of hydrogen, would we get the same value of PV/T at the point where the curves meet on the y-axis? If not, what mass of hydrogen
Yields the same value of PV/T (for low pressure high temperature region of the plot) ? (Molecular mass of H2 = 2.02 u, of O2 = 32.0 u, R = 8.31 J mo1–1 K–1.)
13.3 Figure 13.8 shows plot of PV/T versus P for 1.00*10–3 kg of oxygen gas at two different temperatures.
(a) What does the dotted plot signify?
(b) Which is true: T1 > T2 or T1 < T2?
(c) What is the value of PV/T where the curves meet on the y-axis?
(d) If we obtained similar plots for 1.00*10–3 kg of hydrogen, would we get the same value of PV/T at the point where the curves meet on the y-axis? If not, what mass of hydrogen
Yields the same value of PV/T (for low pressure high temperature region of the plot) ? (Molecular mass of H2 = 2.02 u, of O2 = 32.0 u, R = 8.31 J mo1–1 K–1.)
13.3 (a) The dotted plot in the graph signifies the ideal behaviour of the gas, i.e. = R, (where is the number of moles and R is the universal gas constant) is a constant quantity. It is not dependent on the pressure of the gas. The curve of the gas at temperature is closer to the dotted plot th
 Upvote
Similar Questions for you
PV = nRT
->Pµn
->Ratio=
Taking an Exam? Selecting a College?
Get authentic answers from experts, students and alumni that you won't find anywhere else.
On Shiksha, get access to
Learn more about...

physics ncert solutions class 11th 2023
View Exam DetailsMost viewed information
SummaryDidn't find the answer you were looking for?
Search from Shiksha's 1 lakh+ Topics
Ask Current Students, Alumni & our Experts
Have a question related to your career & education?
See what others like you are asking & answering