
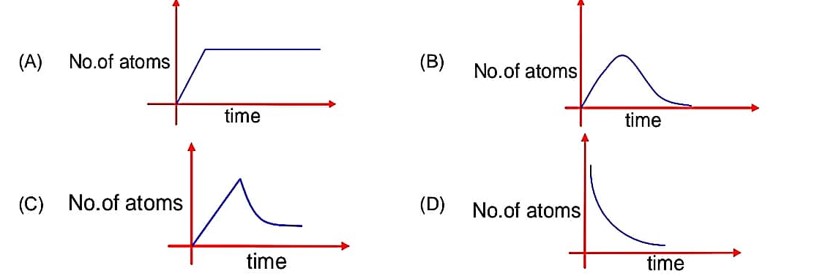
A sample of a radioactive nucleus A disintegrates to another radioactive nucleus B, which in turns disintegrates to some other stable nucleus C. Plot of a graph showing the variation of number of atoms of nucleus B vesus time is:
(Assume that a t = 0, there are no B atoms in the sample)
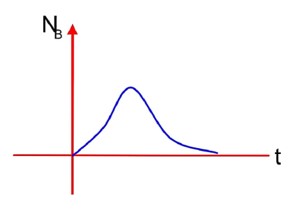
A sample of a radioactive nucleus A disintegrates to another radioactive nucleus B, which in turns disintegrates to some other stable nucleus C. Plot of a graph showing the variation of number of atoms of nucleus B vesus time is:
(Assume that a t = 0, there are no B atoms in the sample)
Amount of B,
where K =
 Upvote
Similar Questions for you
N = N0e–λt
->t = λN = N0/e
So number of nuclei decayed = N0 – N
= N0 (1- 1/e)
Density of nuclei is order of 1017 kg m–3.
Density of nuclei is order of 1017 kg m-3.
Number of half lives of Y = 3
Number of half lives of X = 6 [As half life of X is half of that of Y].
Taking an Exam? Selecting a College?
Get authentic answers from experts, students and alumni that you won't find anywhere else.
On Shiksha, get access to
Learn more about...

Physics Nuclei 2025
View Exam DetailsMost viewed information
SummaryDidn't find the answer you were looking for?
Search from Shiksha's 1 lakh+ Topics
Ask Current Students, Alumni & our Experts
Have a question related to your career & education?
See what others like you are asking & answering