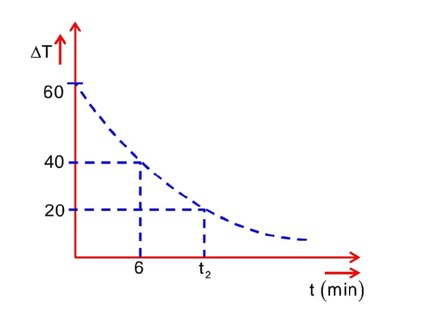
In an experiment to verigy Newton’s law of cooling, a graph is plotted between, the temperature difference
of the water and surrounding and time as shown in figure. The initial temperature of water is taken as
The value of t2 as mentioned in the graph will be _______.
In an experiment to verigy Newton’s law of cooling, a graph is plotted between, the temperature difference of the water and surrounding and time as shown in figure. The initial temperature of water is taken as The value of t2 as mentioned in the graph will be _______.
-
1 Answer
-

- (1)
Now
t = 10.257
t2 = 6 + 10.257 = 16.257 minutes
16.25 and or 16
Taking an Exam? Selecting a College?
Get authentic answers from experts, students and alumni that you won't find anywhere else
Sign Up on ShikshaOn Shiksha, get access to
- 66k Colleges
- 1.2k Exams
- 681k Reviews
- 1800k Answers
