
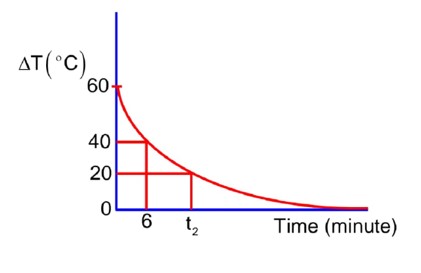
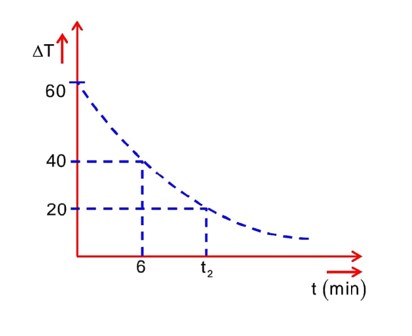
In an experiment to verigy Newton's law of cooling, a graph is plotted between, the temperature difference of the water and surrounding and time as shown in figure. The initial temperature of water is taken as The value of t2 as mentioned in the graph will be _______.
In an experiment to verigy Newton's law of cooling, a graph is plotted between, the temperature difference of the water and surrounding and time as shown in figure. The initial temperature of water is taken as The value of t2 as mentioned in the graph will be _______.
12 Views|Posted 10 months ago
Asked by Shiksha User
1 Answer
A
Answered by
10 months ago
- (1)
Now
t = 10.257
t2 = 6 + 10.257 = 16.257 minutes
16.25 and or 16
 Upvote
Similar Questions for you
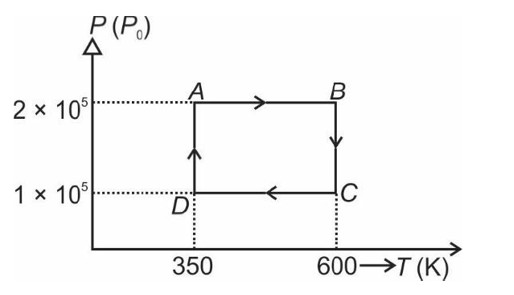
From A to B the process is isobaric
= W = 2 × R (600 - 350)
= 500 R
Taking an Exam? Selecting a College?
Get authentic answers from experts, students and alumni that you won't find anywhere else.
On Shiksha, get access to
66K
Colleges
|
1.2K
Exams
|
7.1L
Reviews
|
1.9M
Answers
Learn more about...

Physics NCERT Exemplar Solutions Class 11th Chapter Eight 2025
View Exam DetailsMost viewed information
SummaryDidn't find the answer you were looking for?
Search from Shiksha's 1 lakh+ Topics
or
Ask Current Students, Alumni & our Experts
Have a question related to your career & education?
or
See what others like you are asking & answering