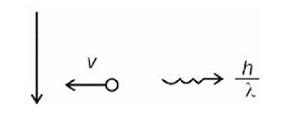
In photoelectric effect experiment, the graph of stopping potential V versus reciprocal of wavelength obtained is shown in the figure. As the intensity of incident radiation is increased:
In photoelectric effect experiment, the graph of stopping potential V versus reciprocal of wavelength obtained is shown in the figure. As the intensity of incident radiation is increased:
Sol. eVslop = hc/λ - φ
Slope of curve
tan θ = hc/e = constant
as intensity of incident radiation is increased, there will be no effect on graph
Similar Questions for you
Kindly go through the solution
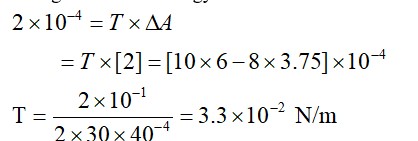
Change in surface energy = work done
|DE0| = –10.2

]
= 3 m/s
n = 4
Number of transitions =
Kinetic energy: Potential energy = 1 : –2
Taking an Exam? Selecting a College?
Get authentic answers from experts, students and alumni that you won't find anywhere else.
On Shiksha, get access to
Learn more about...

Physics Atoms 2025
View Exam DetailsMost viewed information
SummaryDidn't find the answer you were looking for?
Search from Shiksha's 1 lakh+ Topics
Ask Current Students, Alumni & our Experts
Have a question related to your career & education?
See what others like you are asking & answering


