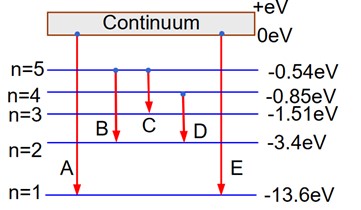
In the given, figure, the energy levels of hydrogen atom have been shown along with some transitions marked A, B, C, D and E. The transitions A, B and C respectively represents:
Option 1 -<p>The series limit of Lyman series, second member of Balmer series and second member of Paschen series</p>
Option 2 -<p>The first member of the Lyman series, third member of Balmer series and second member of Paschen series.</p>
Option 3 -<p>The ionization potential of hydrogen, second member of Balmer series and third member of Paschen series.</p>
Option 4 -<p>The series of Lyman series, third member of Balmer series and second member of Paschen series.</p>

 Upvote