
The correct graph between logeR and loge( - 0) during cooling of a body may be (R is the rate of cooling and 0 is surrounding temperature)
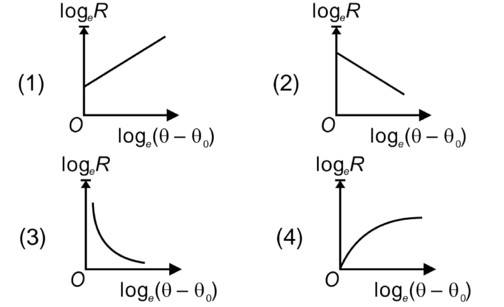
The correct graph between logeR and loge( - 0) during cooling of a body may be (R is the rate of cooling and 0 is surrounding temperature)
Option 1 - <p>1</p>
Option 2 - <p>2</p>
Option 3 - <p>3</p>
Option 4 - <p>4</p>
2 Views|Posted 10 months ago
Asked by Shiksha User
1 Answer
V
Answered by
10 months ago
Correct Option - 1
Detailed Solution:
 Upvote
Similar Questions for you
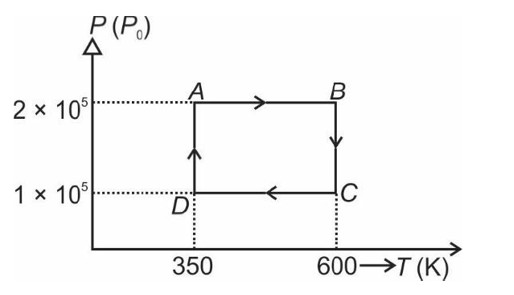
From A to B the process is isobaric
= W = 2 × R (600 - 350)
= 500 R
Taking an Exam? Selecting a College?
Get authentic answers from experts, students and alumni that you won't find anywhere else.
On Shiksha, get access to
66K
Colleges
|
1.2K
Exams
|
7.1L
Reviews
|
1.9M
Answers
Learn more about...

Didn't find the answer you were looking for?
Search from Shiksha's 1 lakh+ Topics
or
Ask Current Students, Alumni & our Experts
Have a question related to your career & education?
or
See what others like you are asking & answering