
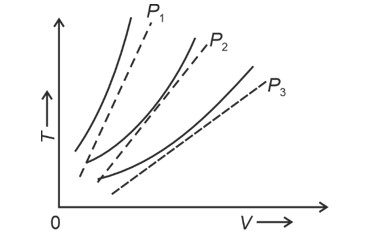
The following graph represents the curves of an ideal gas (where is the temperature and the volume) at three pressures and compared with those of Charles's law represented as dotted lines.
The following graph represents the curves of an ideal gas (where is the temperature and the volume) at three pressures and compared with those of Charles's law represented as dotted lines.
Option 1 - <p><span contenteditable="false"> <math> <mrow> <msub> <mrow> <mi>P</mi> </mrow> <mrow> <mn>3</mn> </mrow> </msub> <mo>></mo> <msub> <mrow> <mi>P</mi> </mrow> <mrow> <mn>2</mn> </mrow> </msub> <mo>></mo> <msub> <mrow> <mi>P</mi> </mrow> <mrow> <mn>1</mn> </mrow> </msub> </mrow> </math> </span></p>
Option 2 - <p><span contenteditable="false"> <math> <mrow> <msub> <mrow> <mi>P</mi> </mrow> <mrow> <mn>1</mn> </mrow> </msub> <mo>></mo> <msub> <mrow> <mi>P</mi> </mrow> <mrow> <mn>3</mn> </mrow> </msub> <mo>></mo> <msub> <mrow> <mi>P</mi> </mrow> <mrow> <mn>2</mn> </mrow> </msub> </mrow> </math> </span></p>
Option 3 - <p><span contenteditable="false"> <math> <mrow> <msub> <mrow> <mi>P</mi> </mrow> <mrow> <mn>2</mn> </mrow> </msub> <mo>></mo> <msub> <mrow> <mi>P</mi> </mrow> <mrow> <mn>1</mn> </mrow> </msub> <mo>></mo> <msub> <mrow> <mi>P</mi> </mrow> <mrow> <mn>3</mn> </mrow> </msub> </mrow> </math> </span></p>
Option 4 - <p><span contenteditable="false"> <math> <mrow> <msub> <mrow> <mi>P</mi> </mrow> <mrow> <mn>1</mn> </mrow> </msub> <mo>></mo> <msub> <mrow> <mi>P</mi> </mrow> <mrow> <mn>2</mn> </mrow> </msub> <mo>></mo> <msub> <mrow> <mi>P</mi> </mrow> <mrow> <mn>3</mn> </mrow> </msub> </mrow> </math> </span></p>
4 Views|Posted 11 months ago
Asked by Shiksha User
1 Answer
A
Answered by
11 months ago
Correct Option - 4
Detailed Solution:
At same temperature, curve with higher volume corresponds to lower pressure.
(We draw a straight line parallel to volume axis to get this)
 Upvote
Similar Questions for you
PV = nRT
->Pµn
->Ratio=
Taking an Exam? Selecting a College?
Get authentic answers from experts, students and alumni that you won't find anywhere else.
On Shiksha, get access to
66K
Colleges
|
1.2K
Exams
|
7.1L
Reviews
|
1.9M
Answers
Learn more about...

physics ncert solutions class 11th 2023
View Exam DetailsMost viewed information
SummaryDidn't find the answer you were looking for?
Search from Shiksha's 1 lakh+ Topics
or
Ask Current Students, Alumni & our Experts
Have a question related to your career & education?
or
See what others like you are asking & answering