
The variation of displacement with time of a particle executing free simple harmonic moton is shown in the figure. The potential energy U(x) versus time (t) plot of the particle is correctly shown in figure:
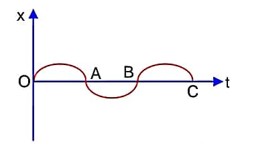
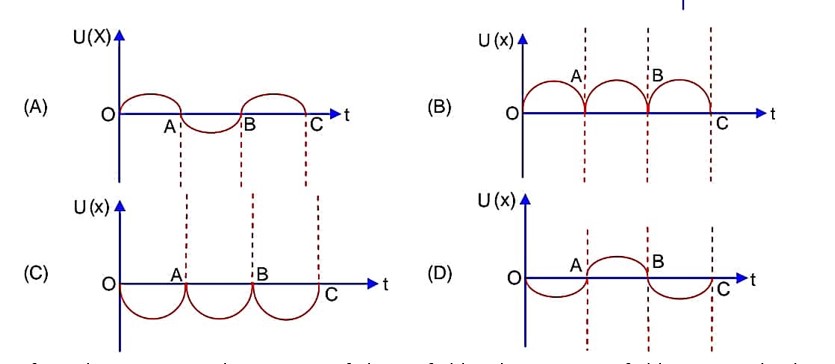
The variation of displacement with time of a particle executing free simple harmonic moton is shown in the figure. The potential energy U(x) versus time (t) plot of the particle is correctly shown in figure:
Potential Energy is maximum at extreme position
 Upvote
Similar Questions for you
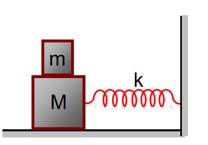
Velocity of block in equilibrium, in first case,
Velocity of block in equilibrium, is second case,
From conservation of momentum,
Mv = (M + m) v’
f? = 300 Hz
3rd overtone = 7f? = 2100 Hz
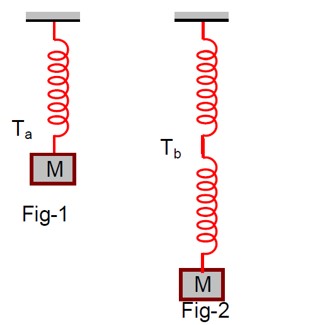
Kindly consider the following figure
K = U
½ mω² (A² - x²) = ½ mω²x²
A² - x² = x²
A² = 2x²
x = ± A/√2
Taking an Exam? Selecting a College?
Get authentic answers from experts, students and alumni that you won't find anywhere else.
On Shiksha, get access to
Learn more about...

Physics Oscillations 2025
View Exam DetailsMost viewed information
SummaryDidn't find the answer you were looking for?
Search from Shiksha's 1 lakh+ Topics
Ask Current Students, Alumni & our Experts
Have a question related to your career & education?
See what others like you are asking & answering