
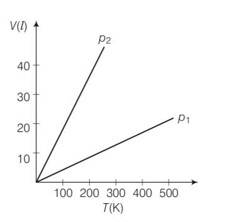
Volume versus temperature graphs for a given mass of an ideal gas are shown in Fig. at two different values of constant pressure. What can be inferred about relation between p1 & p2 ?
(a) p1 > p2
(b) p1 = p2
(c) p1 < p2
(d) Data is insufficient.
Volume versus temperature graphs for a given mass of an ideal gas are shown in Fig. at two different values of constant pressure. What can be inferred about relation between p1 & p2 ?

(a) p1 > p2
(b) p1 = p2
(c) p1 < p2
(d) Data is insufficient.
5 Views|Posted a year ago
Asked by Shiksha User
1 Answer
P
Answered by
a year ago
This is a multiple choice answer as classified in NCERT Exemplar
(a) Pressure is inversely proportional to slope
So
So p1 > p2
 Upvote
Similar Questions for you
PV = nRT
->Pµn
->Ratio=
Taking an Exam? Selecting a College?
Get authentic answers from experts, students and alumni that you won't find anywhere else.
On Shiksha, get access to
66K
Colleges
|
1.2K
Exams
|
7.1L
Reviews
|
1.9M
Answers
Learn more about...

physics ncert solutions class 11th 2023
View Exam DetailsMost viewed information
SummaryDidn't find the answer you were looking for?
Search from Shiksha's 1 lakh+ Topics
or
Ask Current Students, Alumni & our Experts
Have a question related to your career & education?
or
See what others like you are asking & answering