
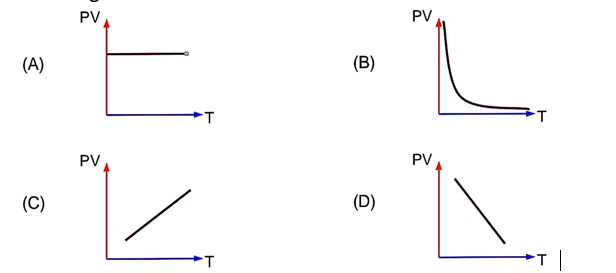
Which of the following graphs represent the behaviour of an ideal gas? Symbol have their usual meaning.
Which of the following graphs represent the behaviour of an ideal gas? Symbol have their usual meaning.
Option 1 - <p>a</p>
Option 2 - <p>b</p>
Option 3 - <p>c</p>
Option 4 - <p>d</p>
13 Views|Posted 11 months ago
Asked by Shiksha User
1 Answer
V
Answered by
11 months ago
Correct Option - 3
Detailed Solution:
According to ideal gas law we know that
PV = nRT
 Upvote
Similar Questions for you
PV = nRT
->Pµn
->Ratio=
Taking an Exam? Selecting a College?
Get authentic answers from experts, students and alumni that you won't find anywhere else.
On Shiksha, get access to
66K
Colleges
|
1.2K
Exams
|
7.1L
Reviews
|
1.9M
Answers
Learn more about...

physics ncert solutions class 11th 2023
View Exam DetailsMost viewed information
SummaryDidn't find the answer you were looking for?
Search from Shiksha's 1 lakh+ Topics
or
Ask Current Students, Alumni & our Experts
Have a question related to your career & education?
or
See what others like you are asking & answering