
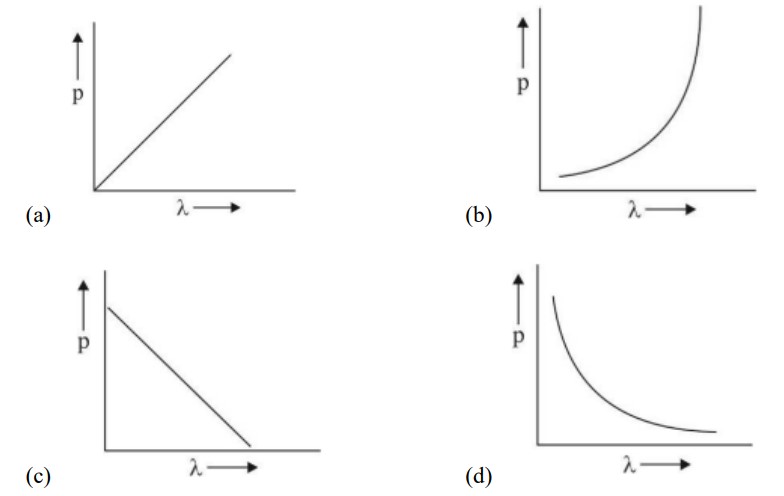
Which of the following graphs correctly represents the variation of particle momentum with associated de-Broglie wavelength ?
Which of the following graphs correctly represents the variation of particle momentum with associated de-Broglie wavelength ?
Option 1 - <p>a</p>
Option 2 - <p>b</p>
Option 3 - <p>c</p>
Option 4 - <p>d</p>
5 Views|Posted 6 months ago
Asked by Shiksha User
1 Answer
V
Answered by
6 months ago
Correct Option - 4
Detailed Solution:
λ = h/p there is inverse relation between de-Broglie wavelength and momentum, hence the graph will be rectangular hyperbola.
 Upvote
Similar Questions for you
CH3COOH + NaOH → CH3COONa + H2O
ΔH = –50.6 kJ/mol
NaOH + SA [HCl] → NaCl + H2O
ΔH = –55.9 kJ/mol
the value of ΔH for ionisation of CH3COOH
⇒ ΔH = +55.9 – 50.6
5.3 kJ/mol
Kindly consider the solution
Fact.
Kindly go through the solution
Taking an Exam? Selecting a College?
Get authentic answers from experts, students and alumni that you won't find anywhere else.
On Shiksha, get access to
66K
Colleges
|
1.2K
Exams
|
6.9L
Reviews
|
1.8M
Answers
Learn more about...

Didn't find the answer you were looking for?
Search from Shiksha's 1 lakh+ Topics
or
Ask Current Students, Alumni & our Experts
Have a question related to your career & education?
or
See what others like you are asking & answering