
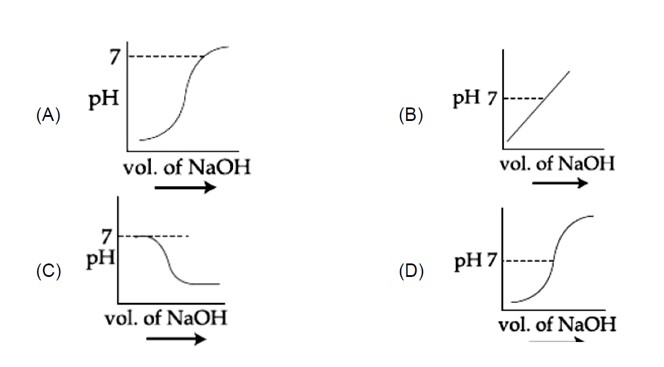
of is taken in a beaker and to it of is added in steps of and the is continuously measured. Which of the following graphs correctly depicts the change in ?
of is taken in a beaker and to it of is added in steps of and the is continuously measured. Which of the following graphs correctly depicts the change in ?
At equivalence point is 7 and increases with addition of so correct graph is (1).
 Upvote
Similar Questions for you
ΔG° = –RT * 2.303 log K
–nFE° = +RT * 2.303 log K
2 * 96500 * 0.295 = 8.314 * 298 * 2.303 log10 K
10 = log10 K = 1010
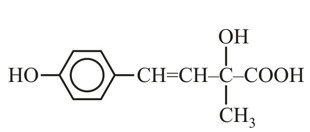
It has chiral centre and differently di substituted double bonded carbon atoms.
Rate of ESR ∝ No. of α – H (Hyperconjugation)
Cr3+ion is a most stable in aqueous solution due to. t2g half filled configuration
Taking an Exam? Selecting a College?
Get authentic answers from experts, students and alumni that you won't find anywhere else.
On Shiksha, get access to
Learn more about...

Chemistry Solutions 2025
View Exam DetailsMost viewed information
SummaryDidn't find the answer you were looking for?
Search from Shiksha's 1 lakh+ Topics
Ask Current Students, Alumni & our Experts
Have a question related to your career & education?
See what others like you are asking & answering