
Pressure versus volume graph for a real gas and an ideal gas are shown in Fig. 5.4.

Answer the following questions on the basis of this graph.
1. Interpret the behaviour of real gas with respect to ideal gas at low pressure.
2. Interpret the behaviour of real gas with respect to ideal gas at high pressure.
3. Mark the pressure and volume by drawing a line at the point where real gas behaves as an ideal gas.
Pressure versus volume graph for a real gas and an ideal gas are shown in Fig. 5.4.
Answer the following questions on the basis of this graph.
1. Interpret the behaviour of real gas with respect to ideal gas at low pressure.
2. Interpret the behaviour of real gas with respect to ideal gas at high pressure.
3. Mark the pressure and volume by drawing a line at the point where real gas behaves as an ideal gas.
This is a short answer type question as classified in NCERT Exemplar
1. At low pressure, the curve of real gas coincides with that of ideal gas, this shows that the deviation of behaviour of real gas with respect to ideal gas is small or negligible.
2. At high pressure, the curve of real gas is far
 Upvote
Similar Questions for you
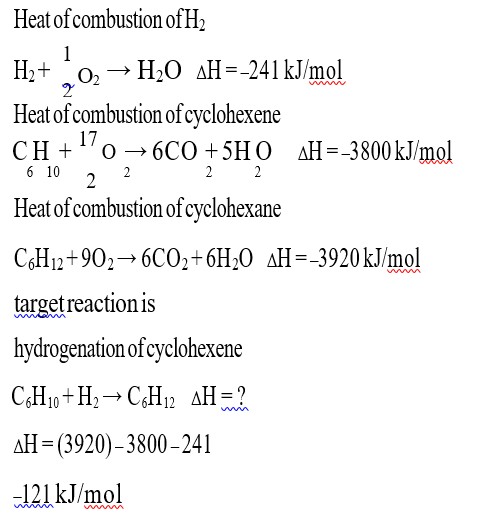
CH3COOH + NaOH → CH3COONa + H2O
ΔH = –50.6 kJ/mol
NaOH + SA [HCl] → NaCl + H2O
ΔH = –55.9 kJ/mol
the value of ΔH for ionisation of CH3COOH
⇒ ΔH = +55.9 – 50.6
5.3 kJ/mol
Kindly consider the solution
Fact.
Kindly go through the solution
Taking an Exam? Selecting a College?
Get authentic answers from experts, students and alumni that you won't find anywhere else.
On Shiksha, get access to
Learn more about...

Chemistry NCERT Exemplar Solutions Class 11th Chapter Five 2025
View Exam DetailsMost viewed information
SummaryDidn't find the answer you were looking for?
Search from Shiksha's 1 lakh+ Topics
Ask Current Students, Alumni & our Experts
Have a question related to your career & education?
See what others like you are asking & answering