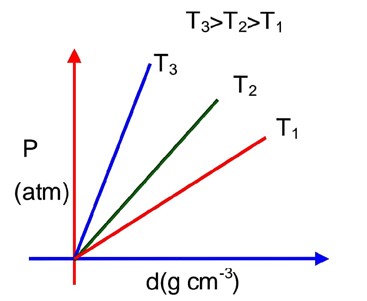
Which amongst the given plots is the correct plot for pressure (p) vs density (d) for an ideal gas?
Which amongst the given plots is the correct plot for pressure (p) vs density (d) for an ideal gas?
Option 1 -
Graph 1.
Option 2 -
Graph 2.
Option 3 -
Graph 3.
Option 4 -
Graph 4.
-
1 Answer
-
Correct Option - 2
Detailed Solution:For ideal gas using ;

PM = dRT
Comparing with y = mx + C
Slope, m =
Slope
So; higher the slope higher the T
Hence, T3 > T2 > T1
Taking an Exam? Selecting a College?
Get authentic answers from experts, students and alumni that you won't find anywhere else
Sign Up on ShikshaOn Shiksha, get access to
- 66k Colleges
- 1.2k Exams
- 681k Reviews
- 1800k Answers
