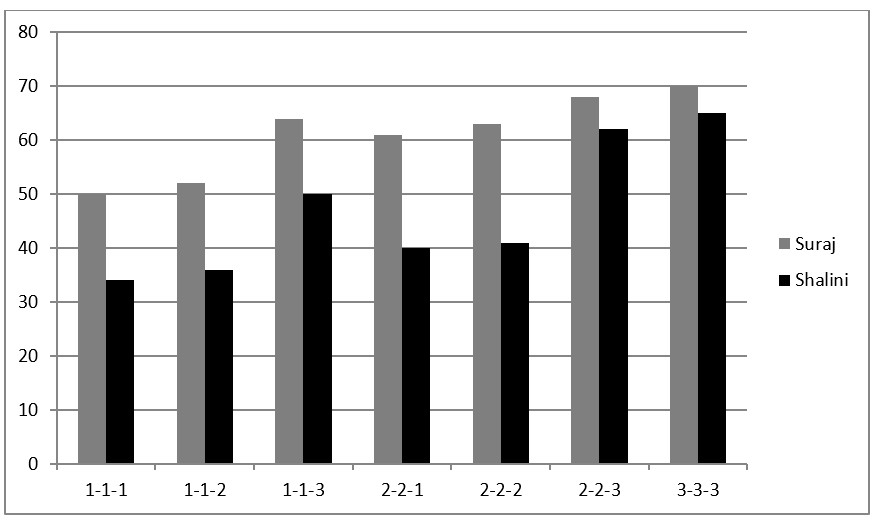
The bar chart given below represents the performance of two students A and B while studying three different subjects with different groups of teachers. Rating given to the teachers are 1, 2, 3 with 1 being the lowest and 3 being the highest.
The bar chart also represents the percentage marks obtained by A and B in three subjects. Each subject carries 100 marks. Students always get integral marks in each subject. For example, if A studies all the three subjects from a group of teachers so that all the three teachers have 1 rating (low rating); then he gets 50% marks of the total marks of the three subject.
What is the percentage change in the total marks obtained by Shalini when we compare the combination 1-1-3 and 2-2-2?
From the 1st statement: B2 is now as old as B3 was in the past. Hence B2 is younger to B3 or B2 < B3. Also sometime in the past B1 was twice as old as B4. So B1 is elder to B4 or B1 > B4. B3 will be as old as B5 in future, hence B3 < B5. The second statement suggests: B1 > B6. B1 was as old as B7 in the past. Hence B1 > B7. B4 will be as old as B6 in future. Hence B6 > B4. B6 will be as old as B7 now in future. Hence B7 > B6