
Figure 12.5 shows the P-V diagram of an ideal gas undergoing a change of state from A to B. Four different parts I, II, III and IV as shown in the figure may lead to the same change of state.
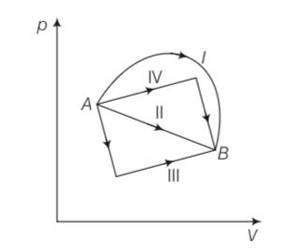
(a) Change in internal energy is same in IV and III cases, but not in I and II
(b) Change in internal energy is same in all the four cases
(c) Work done is maximum in case I
(d) Work done is minimum in case II
This is a multiple choice answer as classified in NCERT Exemplar
(b), (c) Change in internal energy for process A to B
dU=nCvdT=nCv (dT)=nCv (TB-TA)
work done from A to B = area under the PV curve which is maximum for path I
 Upvote
Similar Questions for you
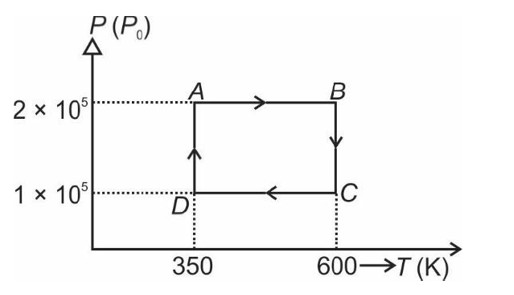
From A to B the process is isobaric
= W = 2 × R (600 - 350)
= 500 R

Heat is path dependent so path function but internal energy does not depend on path chosen.
Taking an Exam? Selecting a College?
Get authentic answers from experts, students and alumni that you won't find anywhere else.
On Shiksha, get access to
Learn more about...

physics ncert solutions class 11th 2023
View Exam DetailsMost viewed information
SummaryDidn't find the answer you were looking for?
Search from Shiksha's 1 lakh+ Topics
Ask Current Students, Alumni & our Experts
Have a question related to your career & education?
See what others like you are asking & answering