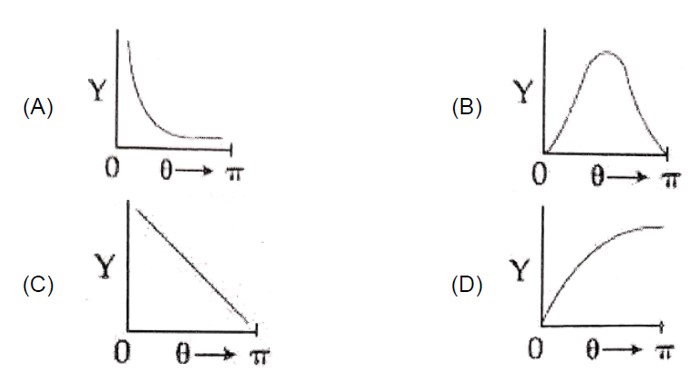
The graph which depicts the results of Rutherford gold foil experiment with
-particles is
: Scattering angle
: Number of scattered
-particles detected
(Plots are schematic and not to scale)
The graph which depicts the results of Rutherford gold foil experiment with -particles is : Scattering angle : Number of scattered -particles detected
(Plots are schematic and not to scale)
Option 1 -
a
Option 2 -
b
Option 3 -
c
Option 4 -
d
Asked by Shiksha User
-
1 Answer
-
Correct Option - 1
Detailed Solution:
Taking an Exam? Selecting a College?
Get authentic answers from experts, students and alumni that you won't find anywhere else
Sign Up on ShikshaOn Shiksha, get access to
- 66k Colleges
- 1.2k Exams
- 681k Reviews
- 1800k Answers

