
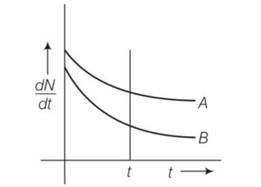
Which sample A or B shown in figure has shorter mean-life?
Which sample A or B shown in figure has shorter mean-life?

3 Views|Posted a year ago
Asked by Shiksha User
1 Answer
A
Answered by
a year ago
This is a Short Answer Type Questions as classified in NCERT Exemplar
Explanation- at t=0 (dN/dt)A= (dN/dt)B
By drawing a perpendicular line across graph (dN/dt)A> (dN/dt)B so decay is faster in A than B
 Upvote
Similar Questions for you
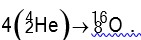
Q = [4 *4.0026 – 15.9994] *931.5 MeV
Q = 10.2 MeV
Taking an Exam? Selecting a College?
Get authentic answers from experts, students and alumni that you won't find anywhere else.
On Shiksha, get access to
66K
Colleges
|
1.2K
Exams
|
7.1L
Reviews
|
1.9M
Answers
Learn more about...

Physics Ncert Solutions Class 12th 2026
View Exam DetailsMost viewed information
SummaryDidn't find the answer you were looking for?
Search from Shiksha's 1 lakh+ Topics
or
Ask Current Students, Alumni & our Experts
Have a question related to your career & education?
or
See what others like you are asking & answering