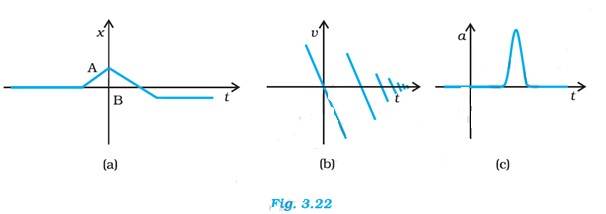
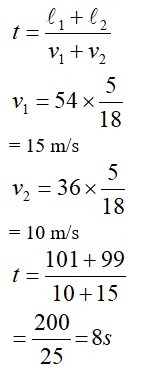
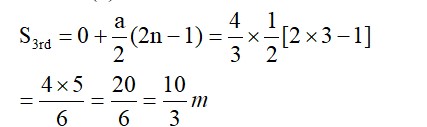
(a) This graph is a Displacement-Time Graph (x- t) that shows the displacement increasing From A to B, and decreasing From B to C. The graph may represent a carom board where the striker hits the edge, rebounds with reduced speed, then moves in the opposite direction, hits the opposite wall and stops.
(b) This graph is a Velocity-Time Graph (v- t) that shows Sudden spikes and drops in velocity. There is a rapid change in velocity. This graph may represent a ball that falls on the ground from a certain height and rebounds with a reduced speed
(c) This graph is an Acceleration -Time Graph (a- t) that shows an instantaneous spike in ac
...more
(a) This graph is a Displacement-Time Graph (x- t) that shows the displacement increasing From A to B, and decreasing From B to C. The graph may represent a carom board where the striker hits the edge, rebounds with reduced speed, then moves in the opposite direction, hits the opposite wall and stops.
(b) This graph is a Velocity-Time Graph (v- t) that shows Sudden spikes and drops in velocity. There is a rapid change in velocity. This graph may represent a ball that falls on the ground from a certain height and rebounds with a reduced speed
(c) This graph is an Acceleration -Time Graph (a- t) that shows an instantaneous spike in acceleration. The graph looks like of a baseball, thrown on to a batter, moves with a uniform speed and then hit by the bat for a very short time interval.
less
<p><strong>(a)</strong> This graph is a <strong>Displacement-Time Graph (x- t)</strong> that shows the displacement increasing From <strong>A to B</strong>, and decreasing From <strong>B to C.</strong> The graph may represent a carom board where the striker hits the edge, rebounds with reduced speed, then moves in the opposite direction, hits the opposite wall and stops.</p><p><strong>(b)</strong> This graph is a <strong>Velocity-Time Graph (v- t) </strong>that shows Sudden spikes and drops in velocity. There is a rapid change in velocity. This graph may represent a ball that falls on the ground from a certain height and rebounds with a reduced speed</p><p><strong>(c)</strong> This graph is an <strong>Acceleration -Time Graph (a- t) </strong>that shows an instantaneous spike in acceleration. The graph looks like of a baseball, thrown on to a batter, moves with a uniform speed and then hit by the bat for a very short time interval.</p>
This website uses Cookies and related technologies for the site to function correctly and securely, improve & personalise your browsing experience, analyse traffic, and support our marketing efforts and serve the Core Purpose. By continuing to browse the site, you agree to Privacy Policy and Cookie Policy.