
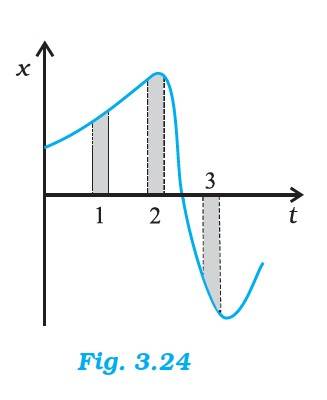
3.21 Figure 3.24 gives the x-t plot of a particle in one-dimensional motion. Three different equal intervals of time are shown. In which interval is the average speed greatest, and in which is it the least? Give the sign of average velocity for each interval.
3.21 Figure 3.24 gives the x-t plot of a particle in one-dimensional motion. Three different equal intervals of time are shown. In which interval is the average speed greatest, and in which is it the least? Give the sign of average velocity for each interval.

3.21 The average speed in Interval 3 is the greatest and in Interval 2 is the least.
The average velocity is +ve in Interval 1 & 2 and –ve in Interval 3.
 Upvote
Similar Questions for you
Please find the solution below:
[h] = ML2T-1
[E] = ML2T-2
[V] = ML2T-2C-1
[P] = MLT-1
According to question, we can write
10 =
Average speed
(d) Initial velocity
Final velocity
Change in velocity
Momentum gain is along
Force experienced is along
Force experienced is in North-East direction.
Taking an Exam? Selecting a College?
Get authentic answers from experts, students and alumni that you won't find anywhere else.
On Shiksha, get access to
Learn more about...

physics ncert solutions class 11th 2023
View Exam DetailsMost viewed information
SummaryDidn't find the answer you were looking for?
Search from Shiksha's 1 lakh+ Topics
Ask Current Students, Alumni & our Experts
Have a question related to your career & education?
See what others like you are asking & answering