
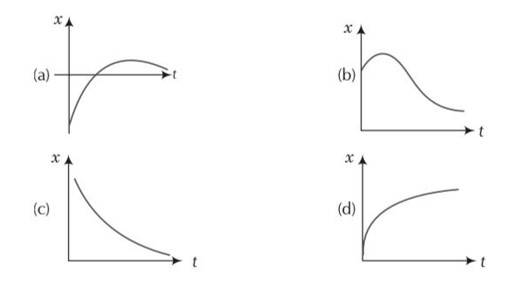
Among the four graphs (Fig. 3.1), there is only one graph for which average velocity over the time interval (0, T ) can vanish for a suitably chosen T. Which one is it?
Among the four graphs (Fig. 3.1), there is only one graph for which average velocity over the time interval (0, T ) can vanish for a suitably chosen T. Which one is it?

This is a multiple choice answer as classified in NCERT Exemplar
(b) To making it vanish one part must cancel other part which is only possible in graph b.
As there are opposite velocities in the interval 0 to T hence average velocity can vanish in b .

 Upvote
Similar Questions for you
Please find the solution below:
[h] = ML2T-1
[E] = ML2T-2
[V] = ML2T-2C-1
[P] = MLT-1
According to question, we can write
10 =
Average speed
(d) Initial velocity
Final velocity
Change in velocity
Momentum gain is along
Force experienced is along
Force experienced is in North-East direction.
Taking an Exam? Selecting a College?
Get authentic answers from experts, students and alumni that you won't find anywhere else.
On Shiksha, get access to
Learn more about...

Physics NCERT Exemplar Solutions Class 11th Chapter Three 2025
View Exam DetailsMost viewed information
SummaryDidn't find the answer you were looking for?
Search from Shiksha's 1 lakh+ Topics
Ask Current Students, Alumni & our Experts
Have a question related to your career & education?
See what others like you are asking & answering