Consider a radioactive nucleus A which decays to a stable nucleus C through the following sequence:
A -> B -> C
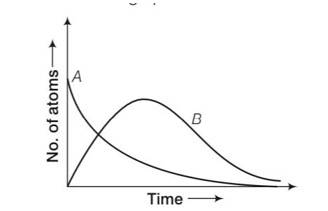
Here B is an intermediate nuclei which is also radioactive. Considering that there are N0 atoms of A initially, plot the graph showing the variation of number of atoms of A and B versus time.
This is a Short Answer Type Questions as classified in NCERT Exemplar
Explanation-
by considering the graph at t=0 NA= No while NB=0 but when time increases the atoms in B also increases and becomes maximum and then drop to zero by radioactive decay law.
<div>This is a Short Answer Type Questions as classified in NCERT Exemplar</div><div><strong>Explanation-</strong></div><div><p>by considering the graph at t=0 N<sub>A</sub>= N<sub>o</sub> while N<sub>B</sub>=0 but when time increases the atoms in B also increases and becomes maximum and then drop to zero by radioactive decay law.</p></div>
This website uses Cookies and related technologies for the site to function correctly and securely, improve & personalise your browsing experience, analyse traffic, and support our marketing efforts and serve the Core Purpose. By continuing to browse the site, you agree to Privacy Policy and Cookie Policy.